Salary Cost Benchmarks for SaaS Startups
Updated: Sep 3
Salary consumes two-thirds of SaaS startup revenue. That's exactly how it should work.
Across nearly 100 private B2B SaaS companies, salary consumes 67.9% of revenue and 57.7% of operating expenses, on average. Not vendor spend. Not marketing. Not tooling. People.

If that number makes you wince, you're reading it wrong. This isn't a dataset of bloated, over-hired startups burning cash to look busy. These are companies that qualified for debt financing — a high bar that requires real revenue, real margins, and real repayment capacity. They earned the right to spend two-thirds of every dollar generated on talent, and the data says they're doing it deliberately, not recklessly.
The source here matters. This isn't a survey where founders self-report what they think good looks like. It's actual data from 83 real B2B SaaS businesses, ranging from $250K to $22M in ARR, all of whom went through debt underwriting. When a lender is deciding whether to extend credit against your startup's revenue, the numbers get scrutinized in a way survey responses never do. That's what makes these salary cost benchmarks worth paying attention to.
Salary as a Percent of Revenue vs. OpEx: Two Metrics That Answer Different Questions
These two ratios sometimes get used interchangeably, and that's a mistake.
Salary as a percent of revenue tells you about monetization: how much top-line you're generating per dollar of headcount cost. It moves with your sales cycle and your growth rate, which is why VCs and board members watch it as a proxy for capital efficiency.
Salary as a percent of operating expenses (OpEx) tells you something specific: how your internal budget is allocated. It's sticky. It doesn't swing with a good sales quarter. It moves when you hire or fire, full stop, which is why CFOs and FP&A teams treat it as the real cost-structure metric.
Salary as % of Revenue | Salary as % of OpEx | |
Core measurement | Indicates overall capital efficiency and path to profitability | Indicates internal cost structure and operational leverage |
Volatility | Fluctuates based on sales cycles and top-line growth rate | Stays relatively fixed; directly reflects headcount changes |
Key audience | Venture Capitalists, Board Members, Founders | CFOs, FP&A Teams, Operations Leaders |
With the metrics clearly defined, let's get into the benchmarks.
The Cost of Human Capital
For the full sample, salary averages 67.9% of revenue (median 66.7%) and 57.7% of OpEx (median 57.4%). Look at how close those averages and medians sit to each other.
Average | Median | |
Salary as % of Revenue | 67.9% | 66.7% |
Salary as % of OpEx | 57.7% | 57.4% |
That tight spread is the real story — it means this isn't a handful of outliers dragging the number around. Salary intensity at this level is structural across the dataset, not an artifact of a few companies with unusual cost structures.
RELATED: 2025 B2B SaaS Startup Benchmarks
Technical Teams Cost More
Break the sample out by industry and one segment stands apart immediately. Data, Infrastructure, Reporting, and Automation companies run salary at 76.3% of revenue and 65.1% of OpEx — well above HR/Legal/Back Office (64.9% / 53.0%) and Marketing & Sales (64.8% / 58.3%).
Average Salary Expense | Average Headcount | Average Salary per Employee | |
Data, Infrastructure, Reporting & Automation | $2,701,033 | 27 | $99,687 |
HR, Legal & Back Office | $2,136,467 | 22 | $97,365 |
Marketing & Sales | $2,687,316 | 23 | $114,557 |
That's not inefficiency. That's the cost of building infrastructure and data products, which demand deeper engineering benches than a workflow tool or a sales platform. If you're building in this category and your salary ratio looks high next to a peer selling marketing software, you're not doing it wrong. You're building a different kind of product.


Leaner on Payroll or on Everything Else?
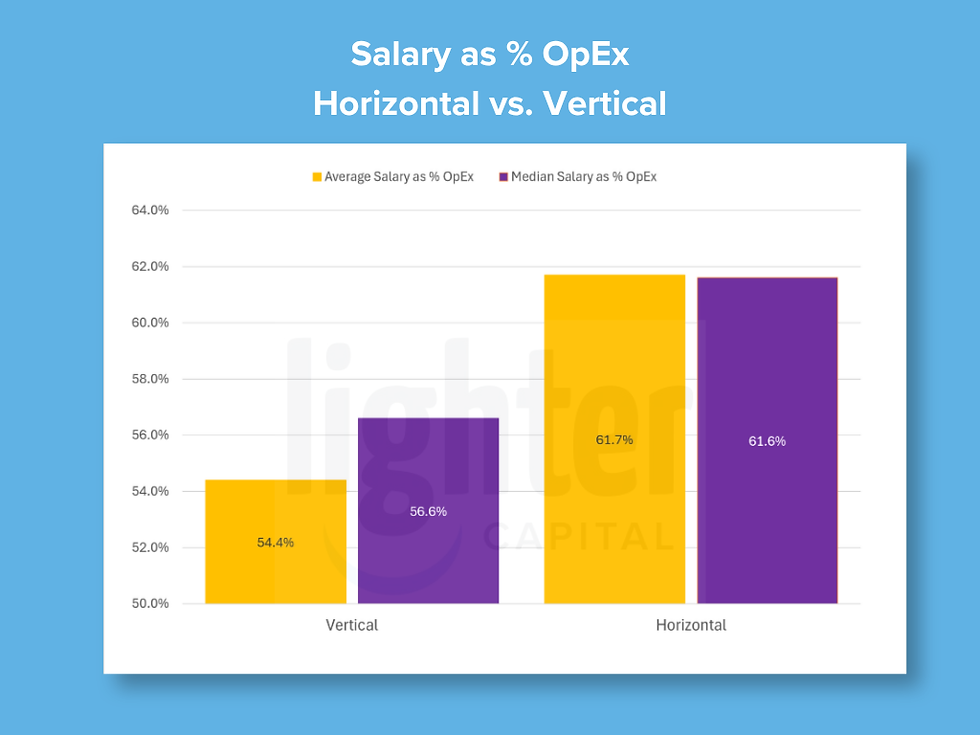
Vertical and horizontal SaaS companies spend almost identically on salary as a share of revenue — 68.3% versus 67.4%. The gap shows up on the OpEx side instead: horizontal companies put 61.7% of their operating budget toward salary, while vertical companies put just 54.4%.
Average Salary Expense | Average Headcount | Average Salary per Employee | |
Vertical | $2,439,420 | 22 | $108,475 |
Horizontal | $2,452,465 | 25 | $97,257 |
Vertical players are carrying more non-people spend — compliance, industry-specific infrastructure, specialized tooling — the overhead that comes with serving a narrow, regulated, or technically demanding niche. Horizontal companies, by contrast, run leaner on everything except headcount. Same revenue efficiency, completely different cost structure underneath it.

Salary Intensity Falls as You Scale
This is the trend that should actually change how you plan to grow. Median salary as a percent of revenue drops from 59% in the $50K–1M cohort to 51% for companies over $10M ARR. Salary costs get leveraged more efficiently against revenue as a company matures — which is exactly what you'd expect from businesses disciplined enough to qualify for debt in the first place.
ARR | Average Salary as % of Revenue | Median Salary as % of Revenue | Count | Number of Outliers |
$50K-$1M | 76% | 59% | 13 | 6 |
$1M-$5M | 70% | 67% | 51 | 0 |
$5M-$10M | 57% | 68% | 12 | 4 |
Over $10M | 52% | 51% | 7 | 0 |
The outliers tell their own story. The earliest-stage cohort (50K–1M) has 6 outliers out of just 13 companies — nearly half the group — which is why the average (76%) sits 17 points above the median (59%). At 5M–10M, the distortion flips: the average (57%) falls below the median (68%), meaning a small number of unusually lean operators are pulling the average down, not up. We assume those are companies have found a low-touch GTM motion that scales without proportional headcount, and they're rare enough to be worth studying, rather than considering them as the norm.

Explore the Interactive SaaS Benchmarks Report
Drill down by industry, revenue, and company age to see where your business actually sits against these cohorts.

The Debt Factor: A Third of Startups Borrow Capital To Hire
Here's the number that should reframe everything above it. One in three companies in this dataset are deploying debt capital specifically into hiring. Not runway extension. Not a rainy-day cushion. Talent acquisition, funded with non-dilutive debt capital, at the exact moment in the startup lifecycle when hiring speed determines the winners and losers.
That's the real solution to a problem every tech founder will face: you're ready to hire aggressively but not ready — or not willing — to raise another equity round. Where, then, should you go for money to grow?
This data shows a willingness among tech founders to underwrite hiring with debt in earlier stages, instead of diluting themselves with an equity raise.

How Did dbt Labs Go From Bootstrapped To Venture-Backed?
One modest round of non-dilutive funding helped dbt Labs hire a world-class team of engineers and hit major milestones that led to investments by Andreessen Horowitz, Sequoia, and Altimeter.
How to Use These Benchmarks
Don't benchmark against the overall average and call it done — segment first. A data infrastructure company running 76% salary-to-revenue isn't underperforming a marketing SaaS company running 65%; they're solving different problems with different cost structures. Compare within your industry and your stage, not across the whole dataset.
Watch the trajectory more than the snapshot. A single quarter's ratio tells you almost nothing. The direction across growth stages — 59% down to 51% as ARR scales past $10M — is the brightest signal. If your salary-to-revenue ratio isn't compressing as you grow, that's worth investigating before your next board meeting, not after.
And if you're staring at a hiring plan you can't fund without giving up equity, look at what many startups have already figured out:
Debt financing exists precisely for this moment — when growth requires headcount and headcount requires capital, but the round you'd need to raise isn't the round you want to raise.
Debt Buyer's Guide
Want to avoid the tricky terms and conditions that can hold your startup back or slow you down? When you know the right questions to ask lenders, you can confidently compare financing costs and how repayments will affect your cash flow. Our debt buyer's guide has you covered.

In Tech, Talent Is The Product
Salary isn't the line item to cut in SaaS. It's the line item that determines whether you have a business at all. The startups in this dataset spend two-thirds of their revenue on people because talent is the product, and the ones who borrow to hire aren't taking on risk — they're buying speed with the one form of capital that doesn't cost them the company.